In this experiment you will construct an $RC$ circuit and observe the voltage build-up across the two plates of the capacitor during the charging process. You will also observe the voltage decay during the discharging process, and investigate the effect of resistance size.
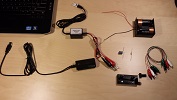
For this purpose, you will need the following items from the lab kit:
As in the previous experiments, you will also need a personal (desktop or laptop) computer with the Logger Pro software installed on it.
Before you begin, review the whole procedure to make sure you understand all the steps involved. Perform proper risk assessment and do not carry out the experiment if you feel that the procedure, equipment, or material poses any safety issues. Remember that safety comes first, and you must always ensure the safety of yourself and any person at your location. If you have any question or concern, please contact your tutor.
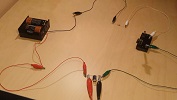
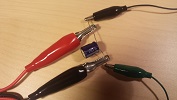
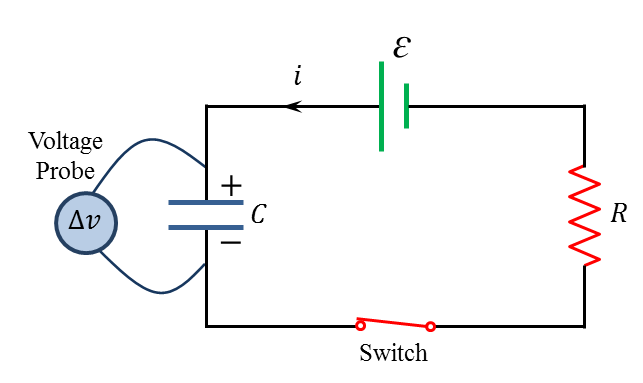
Construct the circuit shown in Figure 3.1 using the $10\,\text{k}\Omega$ resistor, keeping the switch open. Set the voltage probe to measure the potential difference across the capacitor, and start the Logger Pro program on your computer. The reading displayed should be close to $0\,\text{V}$. If it is not, briefly connect a wire across the capacitor to short-circuit its plates and remove any residual charges. After that, click on Experiment in the menu bar and select Zero... from the scroll down menu.
Under Experiment, select Data Collection and set Duration to 30 s. Also set Sampling Rate to 2 samples/second. Double-click in the graph window and deselect the Connect Points option. Under Axes Options, set the $y$ axis range from 0 to 4 volts. To begin measurements, click the green Collect button in the menu bar, and immediately close the switch. This will allow charging and automatic data collection to begin simultaneously. If you get a negative potential reading, reverse the voltage probe terminals and repeat the process above, starting with a completely discharged capacitor. After data acquisition stops, you will have a set of data representing the potential difference across the capacitor versus time, as in Table 3.1. Save the Logger Pro file under a suitable name. Also, make sure to record the resistance ($R$) and capacitance ($C$) values.
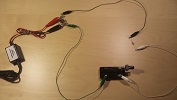
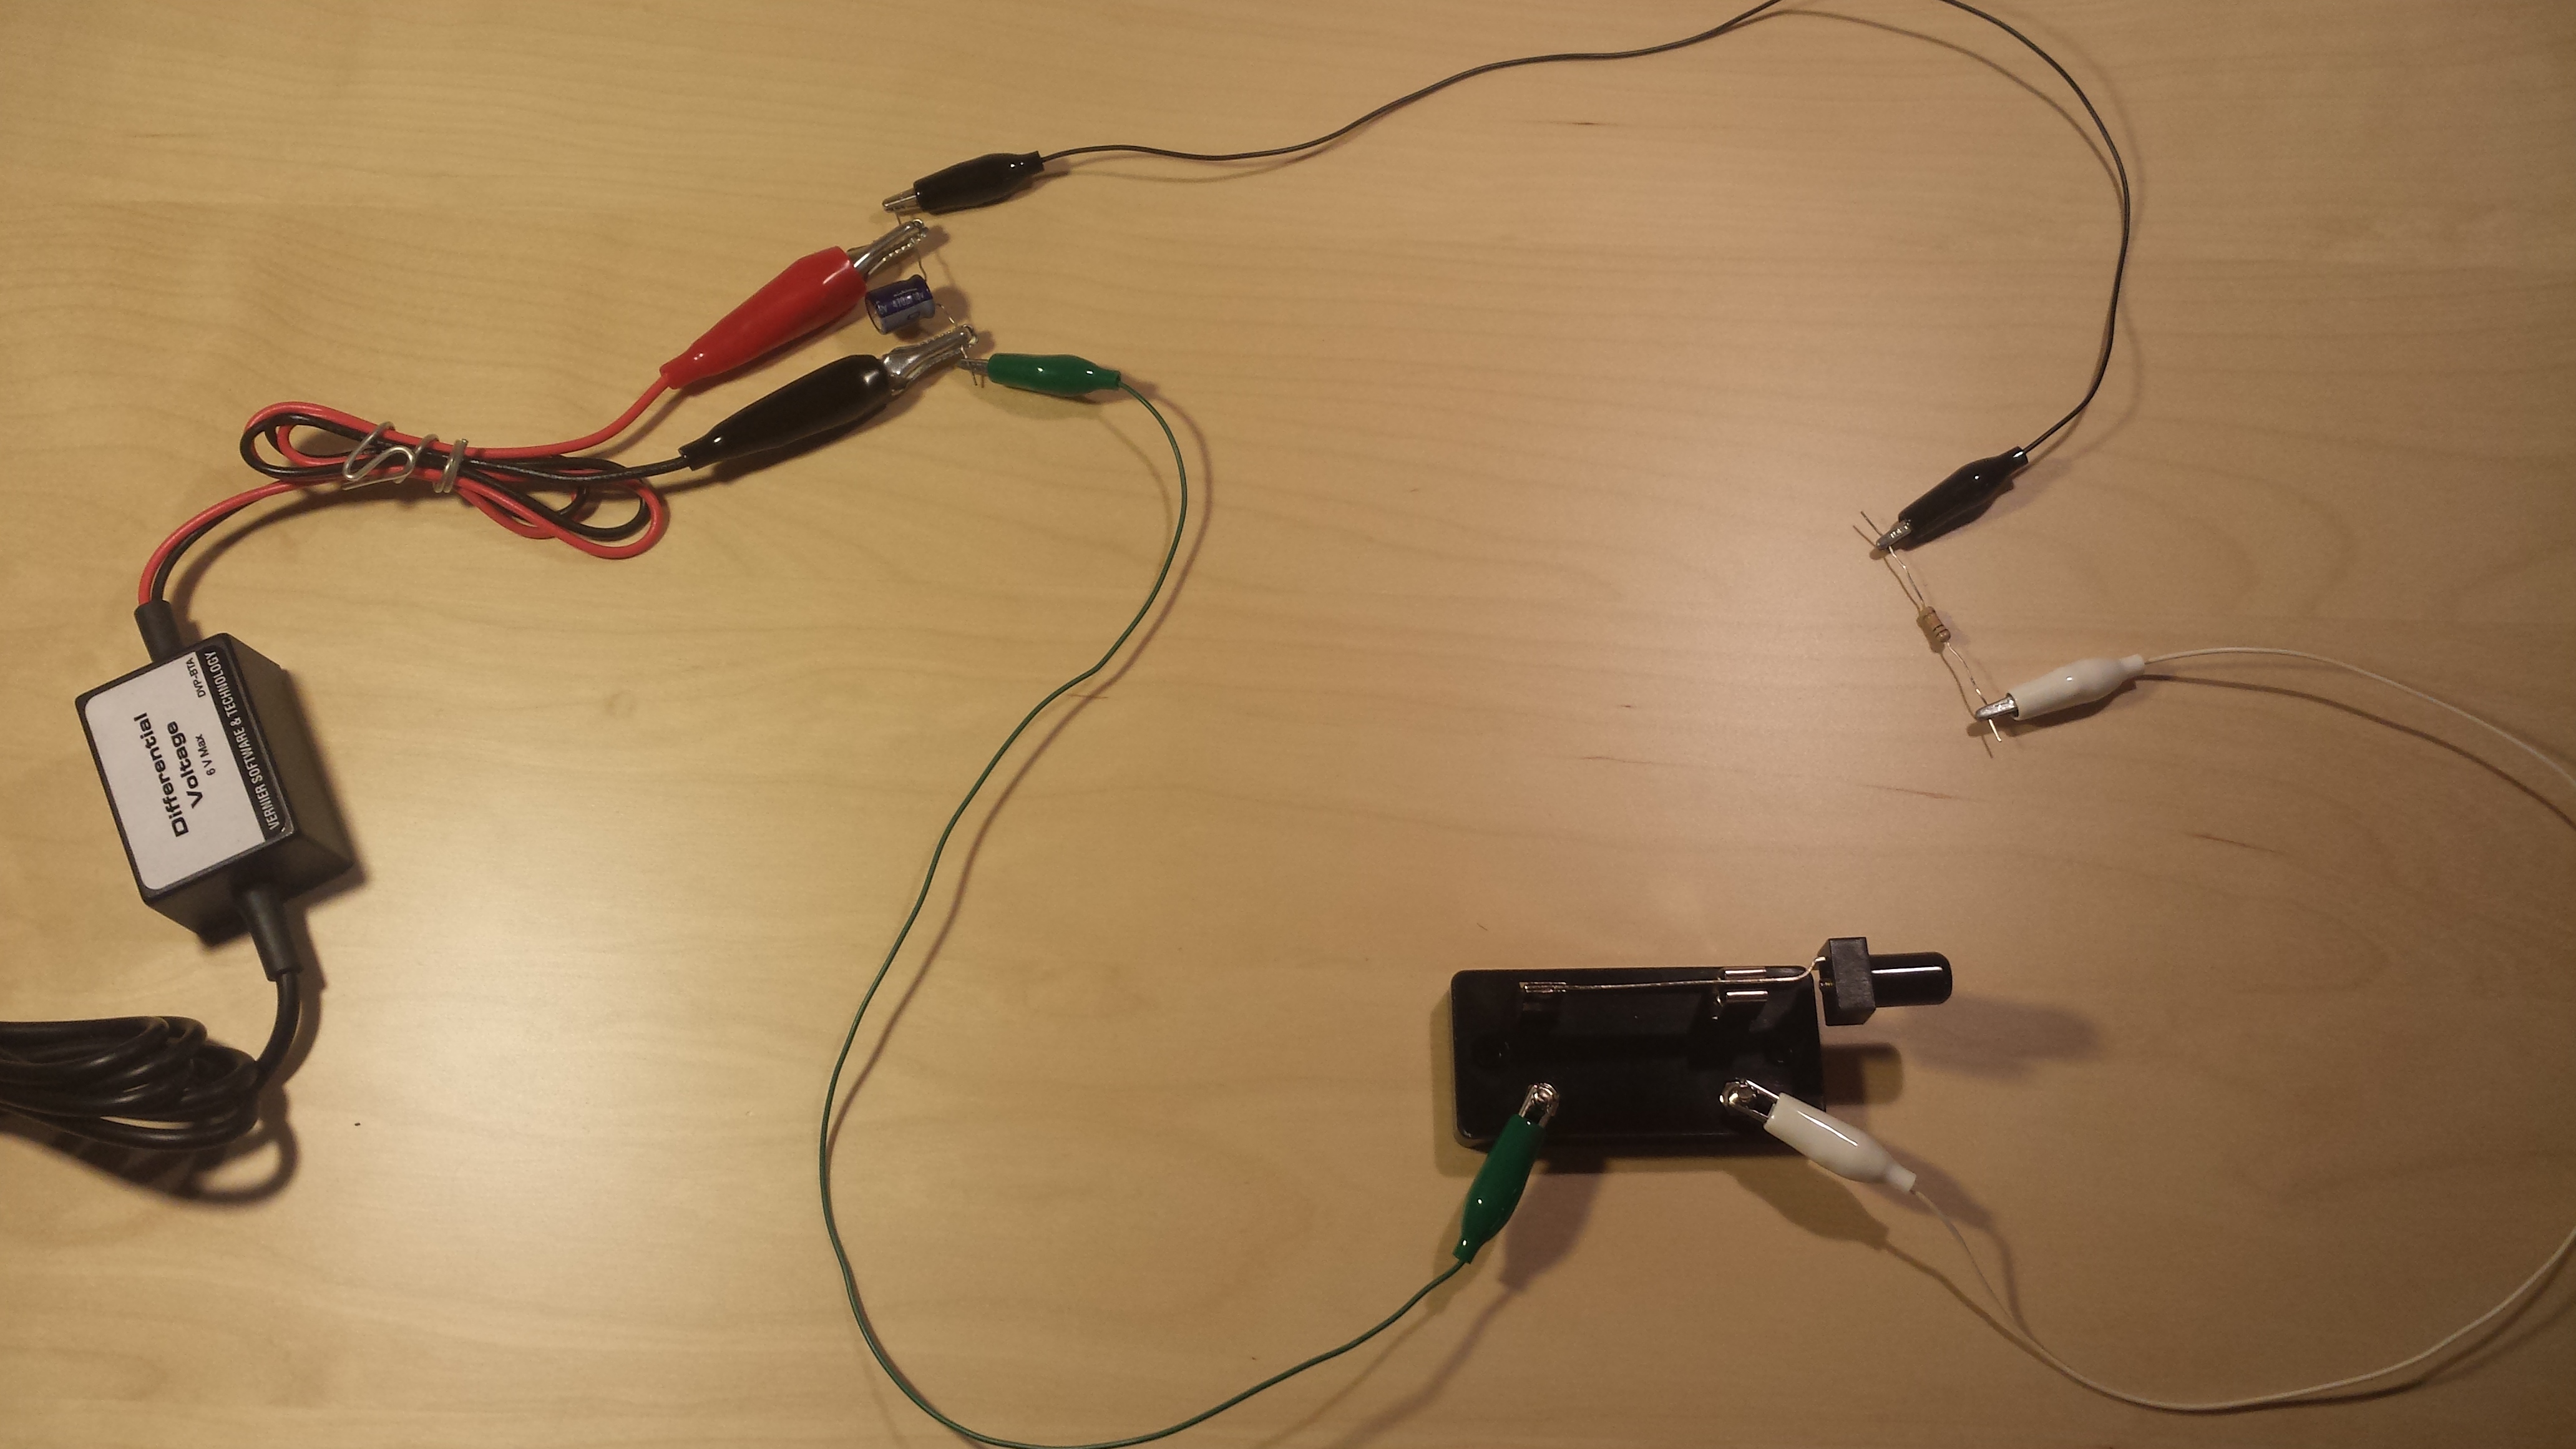
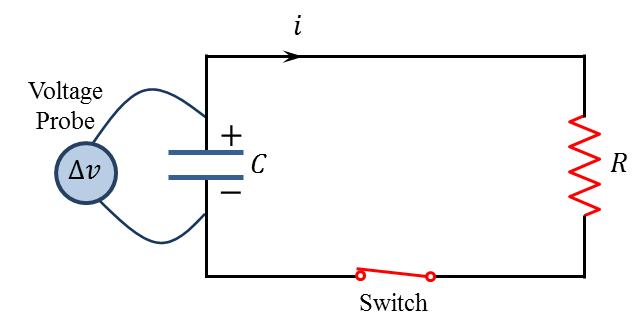
Exit Logger Pro and restart it to open a new file. Keep the circuit connected for few minutes to ensure that the capacitor is fully charged. The reading of the voltage probe should be around 3 V at this point. Remove the battery and reconnect the circuit as shown in Figure 3.2, keeping the switch open. Then, click the Collect button and close the switch, allowing the capacitor to start discharging. You should see a gradual decrease of the potential across the capacitor. When data acquisition stops, save the Logger Pro file under a suitable name. Do not forget to take a picture of your setup before disconnecting the circuit.
Repeat the charging and discharging procedures above, using the $5\,\text{k}\Omega$ and $15\,\text{k}\Omega$ resistors. After completing your measurements, you should have six (or three pairs of) data files corresponding to the three resistors used in the $RC$ circuit.
| Time $t\;(\text{s})$ |
Potential $\Delta v_C\;(\text{V})$ |
| ⁞ | ⁞ |